
Interactive Chart with Tooltip using React and D3.js
In my current project around books, I wanted to add some visualizations using D3.js, which I was introduced to in my class CSE 6242 Data and Visual Analytics at Georgia Tech last semester .
React uses a fundamentally different paradigm for creating user interfaces compared to D3 and traditional web development, enabling developers to declaratively define components while the library takes care of updating the DOM as needed. D3 is designed to bind data to and manipulate DOM nodes directly, so these two libraries are at odds.
After some research leveraging several helpful online resources such as Bringing Together React, D3, And Their Ecosystem, I settled on using a library called react-faux-dom, which provides a mock-DOM API to fool D3 into thinking it’s interacting with the actual DOM, then later renders to a React component. Pretty sweet!
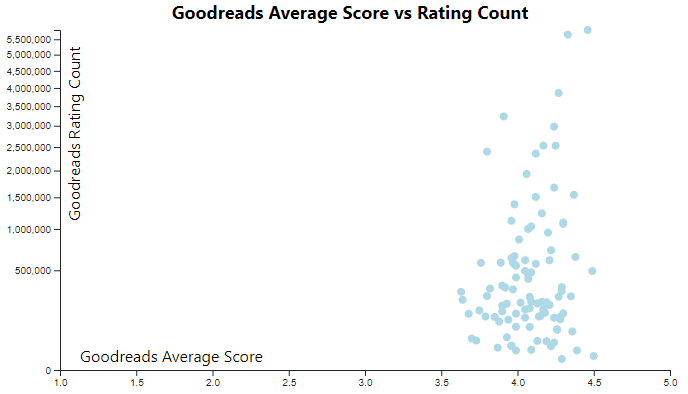
I rendered my first chart based on a sample dataset of 100 top books easily. This was going to be a breeze! The data was starting to come to life. Things started to get complicated, however, when I wanted to add a tooltip to show details about a specific book on hover.
Previously I had used a library called d3-tip to define a tooltip and bind it to the chart elements on mouse-over. But the faux-dom wasn’t exposing the correct properties this library needed. I had to abandon it in favor of a more “React-style” approach.
The core of the tooltip implementation can be seen below. In short, there is a parent component that maintains some state about the tooltip – where it should be located, what it should contain and whether it should be visible or hidden. By passing the “updateTooltipState” function as a prop to the child “chart” component, the chart can update the appropriate state in the parent by calling this function with the new state values.
svg.selectAll("circle")
  .data(data)
  .enter()
  .append("circle")
  .attr("cx", d => xScale(d.gR_Rating) )
  .attr("cy", d => yScale(d.gR_RatingCount) )
  .attr("r", 4)
  .style("fill", "lightblue")
  .on("mouseover", d => {
    this.props.updateTooltipState({
      left: xScale(d.gR_Rating) + 5,
      top: yScale(d.gR_RatingCount) + 5,
      fields: [
        `Title: ${ d.title }`,
        `Author: ${ d.author }`,
        `Rating: ${ d.gR_Rating.toFixed(1) }`,
        `Count: ${ d.gR_RatingCount.toLocaleString() }`
      ]
    });
  })
  .on("mouseout", () => {
    this.props.updateTooltipState({ fields: [] });
  });
Once the parent updates its state with the new values, a render cycle is triggered and the child “tooltip” component updates as necessary. Normally, all children (including the chart itself) would re-render. Doing so on every single mouse action is computationally intensive and did not provide a smooth user experience.
By using the “shouldComponentUpdate” lifecycle method, the chart component gets a chance to inspect the new state and opt-out of re-rendering when the tooltip state is updated. The chart can trigger state updates in its parent without needing to re-render itself!
shouldComponentUpdate(nextProps) {
  return (this.props.books !== nextProps.books);
}
You can see a full working example of this technique on CodePen at
https://codepen.io/jeffro94/pen/LaBRyY.